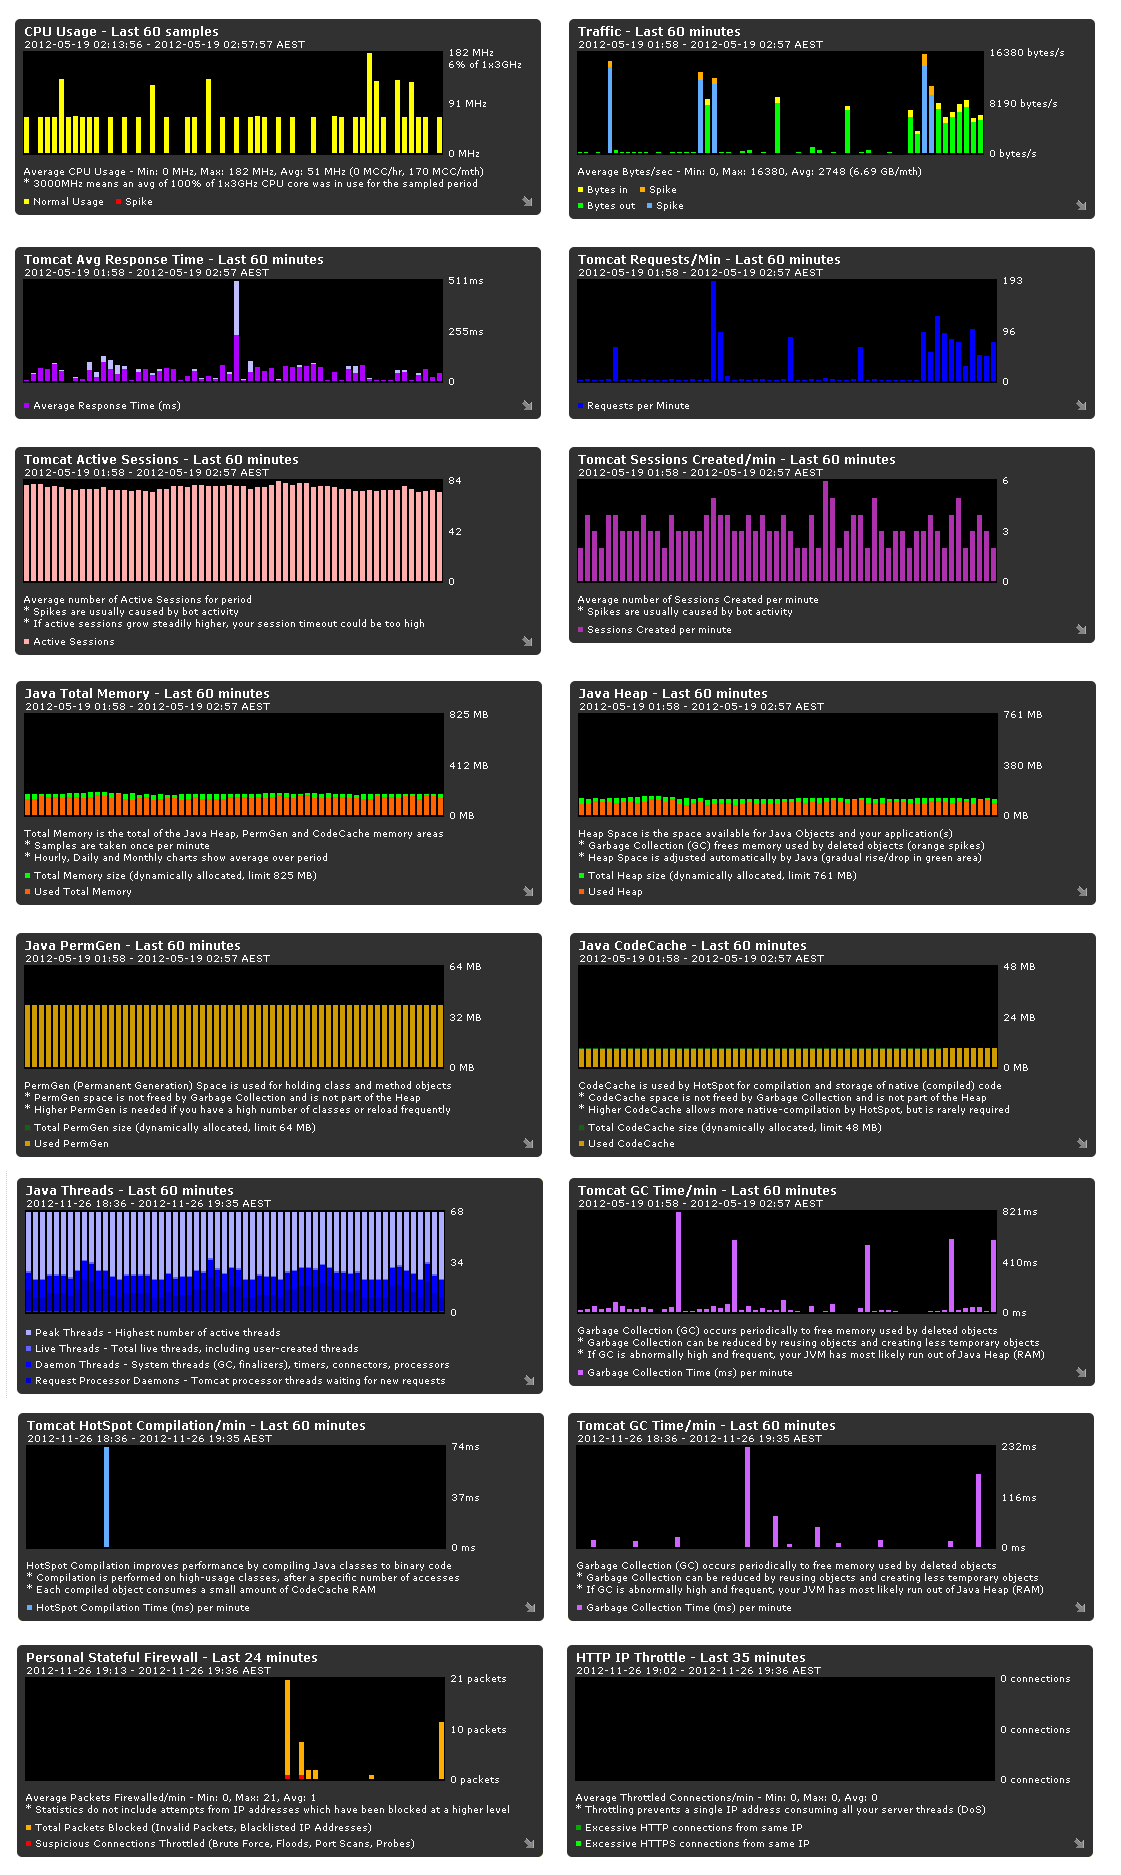
Dashboard Charts
Our dashboard provides 24/7 online historical charting of 16 separate important metrics for each of your JVMs.
Key Business Advantages:
- Make decisions based on trends
- Determine root causes of response time issues and crashes through correlation of various charts and access logs
- Verify actual improvements after code repair and optimization
- Identify your busiest times per day to maximise efficiency of support personnel
- Identify your slowest periods per week to minimise the effect of system maintenance and upgrades
Screenshots
This is an after-hours snapshot from a busy retail website which uses Hibernate/Struts.
How are our charts different to VisualVM?
Systems such as VisualVM are extremely useful in monitoring applications during development. You can view per-second statistics and watch what is happening in real-time. However, in a production environment they fail in 3 critical areas:
- No historical data, monitoring starts and ends when you open and close VisualVM
- Additional monitoring load is placed on the application during monitoring periods
- Difficult to set up in a remote environment (may not be possible, or is too traffic intensive)
Our monitoring runs one snapshot per minute, which is ideal for production systems. It's based on a combination of our ERAI monitoring systems, our traffic recording subsystem, our firewall monitoring, our disk I/O recording subsystems and JMX.
Real-World Usage
The new charts have already helped identify a number of addressable issues for our customers. For example:
- Session-timeout way too high (high usage site, but 14000 active sessions - clearly way too high)
- PermGen space at max (our customer moved 32mb from Heap to PermGen as a result, no more PermGen crashes)
- CPU and GC much higher than expected (our customer was using MangoDB, now moving database to MySQL 5.5)
- JVM near max RAM but not crashing or throwing OutOfMemoryExceptions, causing Confluence to run very slowly (the problem was easy to see with the charts, our customer added more RAM, Confluence sped up massively)
- Large 160kb javascript was being downloaded continually causing high traffic. Customer added caching and compression to their dedicated JVM, reducing costs significantly.
Some comments from our customers:
- "Wow it looks like VisualVM, but available all day, anytime. This is awesome" - Francis Shephard - Yooyah
- "Nice - looks handy. Liking the traffic-by-days feature." - Zac
- "This is uber cool! I can see this could help a lot of different people in a lot of different ways." - Richard
Using the charts:
- Minute / 5m / 30m / Hour / 4h / 8h / Day views
- Zoom-view to see 300+ minutes/hours
- Hover over bars to see exact numbers, dates and times
- Very readable on iPhone(tm) and Android(tm) devices so you can monitor your busy times from anywhere
Sign up to try it out!